

Previously, we started with the basics of the SQL queries and explored what type of questions can be asked using SQL. But we did not write the queries in the part 1 post. If you want to read the first part, i.e. the basics of using sql in Azure ml, then refer here to the previous post. Now we will write queries and execute them and show how to visualise the results; create a network of sql application to perform complex tasks.
Although this post will be as self-contained as possible, reader will be in a better context in this post if (s)he reads the last post mentioned above.
So, we have a data about school inspections in UK uploaded in a experiment named blogarithm in my free workspace in Azure ml. We have already cleaned the data and connected a basic "Apply SQL transformation" function to the cleaned data. Remember to clean your data always before you try to proceed in any analysis as otherwise many of the queries or formula do not work. i.e. in excel, if you try SUM or other type of formula then in presence of empty cells, it may give you garbage value.
So, lets get our hands dirty. First, to remind or refresh, our dataset has information about geographic location of the institutions, types of institutions, numbers of students, their deprivation index, performance, inspection data arrays like start date, concerns, and also almost all data about previous inspections.
(1)
We start off by a simple query to group all the institutions by type of education and phase of education. Here is the query snippet.

Here I have done a generally unusual thing. In case of one word named columns, we do not use a quotation mark around the name. But in this case we have multi worded strings as column name. One can do two things here. One is to change the column names as a pre-processing step. Another is what I have done and basically is using quotation to keep it as one "token" or packet.
Here if you do not put the quotation the column name will be taken as of the first word before the first space comes up in the column name and then that will not match to any existing column name and therefore it will show an error saying "logic error, missing database: no such column named #something". I will deal later on with different type of errors one day. But lets now concentrate on the query part.
After writing this query, please proceed to the Run option on the bottom center. Click Run selected and your "Apply SQL transformation" will run. First, the process may stay cached but then after that it will show running and then a green tick will arrive in the corner of the function box and on the right top corner of the experiment environment, "finished" will appear. Now, lets' visualise the data.
Here is how the data looks like:

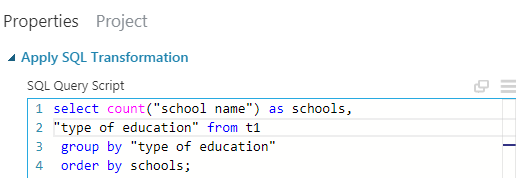
Here I have just printed the number of schools under each phase of education. But One can also print the phase of education alongside, to compare which type of education has the most number of the schools. We do exactly that with the next grouping, based on types of education. In this case we group by the types of education. The query looks like:
 Here I have introduced a new function of SQL named "order by".
One can see in this data, that maximum number of schools are community schools. Also the number of free education centers is less apparently. One can see that, the number of variety of educations denote that there are actually more options in each steps to get into either academy or into industries using technical colleges or academy led colleges. This is a good step.
Further queries which could have been tried are:
(1) number of students undertaking each education criteria
(2)sum of number of students at different phases of education indicating transformation and drop out percentages
To keep the brevity of the post, I am not going to execute these queries but I am writing the required code for both of them as to help someone who wishes to see the result or say explore it more. Please feel free to comment snippets of both data and code or alternative codes down the post in the comment section.
(2)
Now, we may want to look on geographical location of different types of institutes; which pretty much sums up the educational summary in a location.
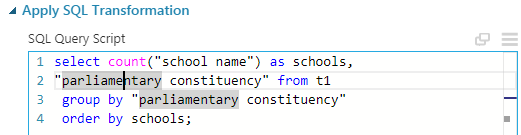
We can basically do this on basis of (1) parliamentary constituency (2) region (3) ofsted region or (4) postal codes. But I will go with the parliamentary constituency and one can do the others just by replacing the word parliamentary constituency in the following query. Here below is the query snippet from the experiment.
Here is how the data looks like:

Here again, as the number of parliamentary constituency is 533, I obviously can not provide the data in this post. Please feel free to do that yourself and I recommend it. Observe that selecting the schools column we can see basic statistics about the number of schools par constituency. There is a large variance in this number which may lead a naive eye to say that some constituency lack schools and some have too many of them. But before saying this, we must use demographic data and divide the number of schools by population of the corresponding constituency's population. Then only it will be schools par person and can give proper idea. I am not going to do that obviously. But one can look for population data in wikipedia. This contains the populations of each constituency of UK.
(3)
Now, we may want to group schools on basis of existing concerns raised on the inspection. This is a similar query with the previous ones but we will build more on it. The first query looks like the following:

Here is how the data looks like:
Now, we try to see how many of these schools are not in concern for this year or the previous year . This can be done with help of a conditional query and the column about previous year concerns. The query I have written here will give the schools common in both years' category of concern with concern NULL which means no concerns. Here is how the query looks like:


(4) One can do a comparison of the student performances in each school of this year and the previous year as both data are available. As I have already performed similar queries with screenshots and all in above, I am now going to mention the query code here and interested ones can try it later.
Query Code:
select "school name" from t1
where "outcomes for pupils" >2
and "previous outcomes for pupils" >2;
We can always change this numbers and get different slices and combinations of the data for similar
queries, like schools who did less than average last time but are good this time, good schools which did bad this year or staffs like that.
We could do the same on the basis of "quality of teaching, learning and assessment" which focuses on the performance of the school in its main function; just by replacing the word "outcomes for pupils" in the second and third line of the code.
So, we inspected some aspects of the data and feel somewhat confident about our knowledge on this data. That's with this data for now, next time we will explore more staffs. Stay tuned.
PS: congratulations on completely reading the document or at least completing all the tasks performed. I have personally observed that if you perform a technical knowledge staff out right while reading, there is almost 2 times more retaining chance of your knowledge than just reading it.
This data was taken from data.gov.uk, uk's free data source.
For detailed sql staffs, you should honestly check out:
(a)W3schools sql classes
(b) datacamp sql bootcamps although here you have to create an account but this is still good.
(c)udemy sql courses this website has great sql courses and I myself has done courses of SQL from here
Although this post will be as self-contained as possible, reader will be in a better context in this post if (s)he reads the last post mentioned above.
So, we have a data about school inspections in UK uploaded in a experiment named blogarithm in my free workspace in Azure ml. We have already cleaned the data and connected a basic "Apply SQL transformation" function to the cleaned data. Remember to clean your data always before you try to proceed in any analysis as otherwise many of the queries or formula do not work. i.e. in excel, if you try SUM or other type of formula then in presence of empty cells, it may give you garbage value.
So, lets get our hands dirty. First, to remind or refresh, our dataset has information about geographic location of the institutions, types of institutions, numbers of students, their deprivation index, performance, inspection data arrays like start date, concerns, and also almost all data about previous inspections.
(1)
We start off by a simple query to group all the institutions by type of education and phase of education. Here is the query snippet.

Here I have done a generally unusual thing. In case of one word named columns, we do not use a quotation mark around the name. But in this case we have multi worded strings as column name. One can do two things here. One is to change the column names as a pre-processing step. Another is what I have done and basically is using quotation to keep it as one "token" or packet.
Here if you do not put the quotation the column name will be taken as of the first word before the first space comes up in the column name and then that will not match to any existing column name and therefore it will show an error saying "logic error, missing database: no such column named #something". I will deal later on with different type of errors one day. But lets now concentrate on the query part.
After writing this query, please proceed to the Run option on the bottom center. Click Run selected and your "Apply SQL transformation" will run. First, the process may stay cached but then after that it will show running and then a green tick will arrive in the corner of the function box and on the right top corner of the experiment environment, "finished" will appear. Now, lets' visualise the data.
Here is how the data looks like:

Here I have just printed the number of schools under each phase of education. But One can also print the phase of education alongside, to compare which type of education has the most number of the schools. We do exactly that with the next grouping, based on types of education. In this case we group by the types of education. The query looks like:
order by:
code: select #something from #some_table ORDER BY some single column ASC/DESC;
Explanation: Order by function orders/sorts (in excel sense) the whole data according to the value of the single column name provided after order by. It is by default ascending in order, but you can use order by desc to get descending order.
Caution: do not try to use order by in more than one occasion. It does not make sense and will raise error.
Now, lets visualise the data. As there are 21 types of education, so my screenshot does not have all the result of it but the main essence of it. So, I will recommend to use the query snippet and see the data for yourself.
Here is what the data looks like:


One can see in this data, that maximum number of schools are community schools. Also the number of free education centers is less apparently. One can see that, the number of variety of educations denote that there are actually more options in each steps to get into either academy or into industries using technical colleges or academy led colleges. This is a good step.
Further queries which could have been tried are:
(1) number of students undertaking each education criteria
(2)sum of number of students at different phases of education indicating transformation and drop out percentages
To keep the brevity of the post, I am not going to execute these queries but I am writing the required code for both of them as to help someone who wishes to see the result or say explore it more. Please feel free to comment snippets of both data and code or alternative codes down the post in the comment section.
code for (1): select count("school name") as schools, sum("Total number of pupils") from t1 group by "type of education";
code for (2): select count("school name") as schools, sum("Total number of pupils") from t1 group by "phase of education";
Observe that along with drop out rate from each phase to other, it will give us average students par each phase's typical education media. Also from (1) we can better understand how many students are taking what type of education and how many students each institute is providing their service to. This number can then be verified to be how good and these are what makes good statistics.
(2)
Now, we may want to look on geographical location of different types of institutes; which pretty much sums up the educational summary in a location.
We can basically do this on basis of (1) parliamentary constituency (2) region (3) ofsted region or (4) postal codes. But I will go with the parliamentary constituency and one can do the others just by replacing the word parliamentary constituency in the following query. Here below is the query snippet from the experiment.

Here is how the data looks like:

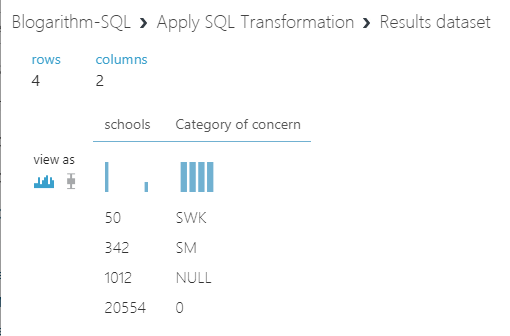
Here again, as the number of parliamentary constituency is 533, I obviously can not provide the data in this post. Please feel free to do that yourself and I recommend it. Observe that selecting the schools column we can see basic statistics about the number of schools par constituency. There is a large variance in this number which may lead a naive eye to say that some constituency lack schools and some have too many of them. But before saying this, we must use demographic data and divide the number of schools by population of the corresponding constituency's population. Then only it will be schools par person and can give proper idea. I am not going to do that obviously. But one can look for population data in wikipedia. This contains the populations of each constituency of UK.
(3)
Now, we may want to group schools on basis of existing concerns raised on the inspection. This is a similar query with the previous ones but we will build more on it. The first query looks like the following:

Here is how the data looks like:

Now, we try to see how many of these schools are not in concern for this year or the previous year . This can be done with help of a conditional query and the column about previous year concerns. The query I have written here will give the schools common in both years' category of concern with concern NULL which means no concerns. Here is how the query looks like:
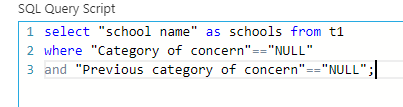
Observe that we have not written NULL directly because then it means the actual NULL than the string "NULL". This is a important point to note. In sql even, you should not set a value equal to something which is a keyword generally used or a boolean or something like that in space of a string or things like that. Hence, be careful!
So, if I had asked for the count("school name") then it would give 1012, the number of schools satisfying the condition. But in general, this type of queries are going to be on a dashboard or a report, hence we should get the list of the schools and that's why I have clearly called the column out in the query. This gives us a 1012 school name among which 1004 are unique. Below here is a view of the data. Obviously again, this is not the full data. Try for yourself and get the full data using the above query.

(4) One can do a comparison of the student performances in each school of this year and the previous year as both data are available. As I have already performed similar queries with screenshots and all in above, I am now going to mention the query code here and interested ones can try it later.
Query Code:
select "school name" from t1
where "outcomes for pupils" >2
and "previous outcomes for pupils" >2;
We can always change this numbers and get different slices and combinations of the data for similar
queries, like schools who did less than average last time but are good this time, good schools which did bad this year or staffs like that.
We could do the same on the basis of "quality of teaching, learning and assessment" which focuses on the performance of the school in its main function; just by replacing the word "outcomes for pupils" in the second and third line of the code.
So, we inspected some aspects of the data and feel somewhat confident about our knowledge on this data. That's with this data for now, next time we will explore more staffs. Stay tuned.
PS: congratulations on completely reading the document or at least completing all the tasks performed. I have personally observed that if you perform a technical knowledge staff out right while reading, there is almost 2 times more retaining chance of your knowledge than just reading it.
This data was taken from data.gov.uk, uk's free data source.
For detailed sql staffs, you should honestly check out:
(a)W3schools sql classes
(b) datacamp sql bootcamps although here you have to create an account but this is still good.
(c)udemy sql courses this website has great sql courses and I myself has done courses of SQL from here
Comments
Post a Comment