Introduction:
Hi guys! I have started working on my Kaggle profile recently. So, this is the first of many, Kaggle project discussions I am going to write in this blog. One of the very famous projects in Kaggle has been the house price prediction data. This data is often used by beginners like me for learning and demonstrating regression. But the reason I have used this data has been to mainly demonstrate the usefulness of a random forest model as a successor of my random forest theory post. If you have not worked on, or read about the random forest before this, please read the random forest for beginner post. In this link, I have curated the complete description for random forests' theory, algorithm, tuning details and every other specific thing.
My stand
Now, let's begin with the house price prediction data. The full jupyter notebook can be found in this Github link. The achieved score is 0.15411, with which I ranked 2863 in the leaderboard, therefore, it is not a very good work which you can say. But the point of this post is not to rank, but to teach how to create simple random forest modeling. For ranking better, you have to do better feature engineering and other things.
Prepping the data:
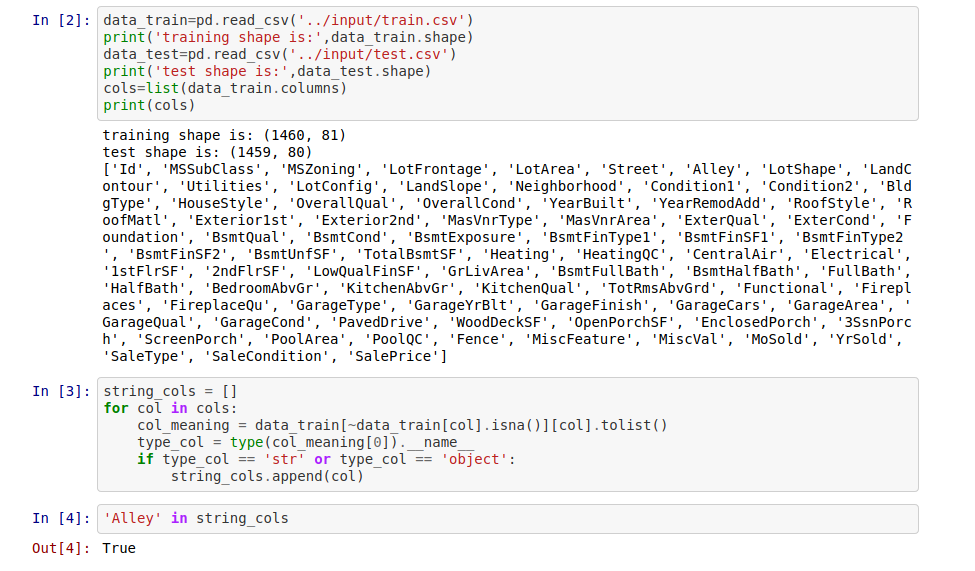
Now that those things are out of our way, let's jump on exploring and prepping the data before we work with the random forest. So like any normal dataset, this data contains some categorical and some other numerical columns. As categorical data can't be used directly in the model, we will use get_dummies from pandas and then created numerical, one-hot encoded versions of them. The code regarding exploration and one-hot encoding is in the below screenshot: 
Clearly, I have taken all the columns which are of the data type object, i.e. denoting string type columns by the "__name__" attribute and then I have appended those columns names in the string column list. Now I will use get dummies in the next shell and create small dataframes from the one-hot-encoded vectors and then keep appending them with the main dataframe. Look at the code snippet below for understanding:
Note that how I have created one function for doing this creation and appending task in case of a generic column. Therefore, I didn't have to write repetitive code for all the columns. Also, note that within these columns some of them are actually ordinal in nature, therefore, they should not be ideally one-hot-encoded to bring the point of comparison. So, this can be a potential point to start better feature creation. But as told beforehand, we will not go down that lane for now.
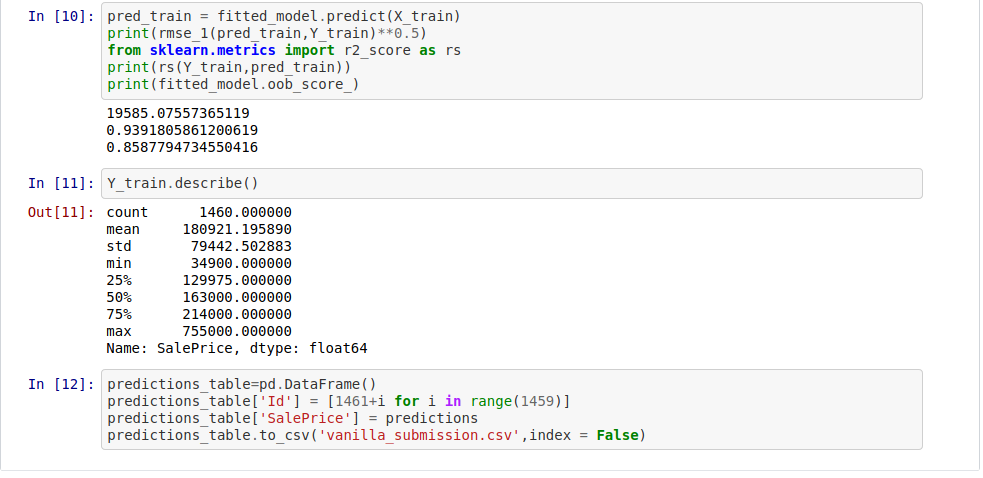
Now, the final slide from this small notebook will be the train-test-split, import of the necessary libraries and training, testing and showing the scores. The necessary point here is that, as it is a training data only and there is no testing data, you need to think about how to validate the result of this training. To do that, one way is to just take a part of the training data and name it as validation data; then treating that score as test data score. But one other thing you can do specifically in case of random forest is that you can use its oob_score_. If you don't know what oob score is or where does it come from in the algorithm, please refer to the random forest for beginner post.
So I have used the oob score method here. I have done manual hyper-parameter-tuning, and the basis of that hyper-parameter-tuning was to basically keep the difference of oob_score_ and the accuracy in training data minimum while increasing the oob_score.
In doing so, I gradually reached the parameters mentioned in the above code snippet. Please note that although I have argued in the theoretical post about no incremental value in increasing n_estimators, here, as the mean squared error was the mark in the competition, therefore, we have taken this high number of estimators. But the end result has not been much different from 128 trees, to clarify.
One other thing we could have done here is to run a grid search for the best parameters in terms of training accuracy and then use that to further predict our values. You can definitely try that by forking my notebook and then starting from this prediction as a baseline.
Finally, in case of Kaggle submissions, you need to be super attentive in maintaining the sample submission format. In my case, the last part of the script, i.e. the following code snippet, I have used to format and create the "vanilla_submission.csv" file, which I finally submitted. Note the use of pd.DataFrame() and csv writing technique below. To know further about how to write csv in python, follow the link.
Thanks for reading this post! for more awesome but basic machine learning tutorials, please subscribe to my channel and stay tuned with my blog!


Comments
Post a Comment